The one thing that Microsoft’s business application platform does is create an amazing amalgamation of things brought from various sources. PowerApps, makes rapid development and deployment of mobile business apps easily achievable. What it also does , very beautifully and easily, is bring in very rich analytics and insights from Power BI, Microsoft’s business intelligence solutions that makes reporting and decision making a breeze.
If you have a lot of visualizations in Power BI, you can easily add them to your PowerApps app with literally a few clicks. Let’s see how.
In Your PowerApps canvas, go to the Insert menu option and select Controls. Scroll to the bottom of the Controls list to find Power BI Tile. Click that option to add it to the app canvas.

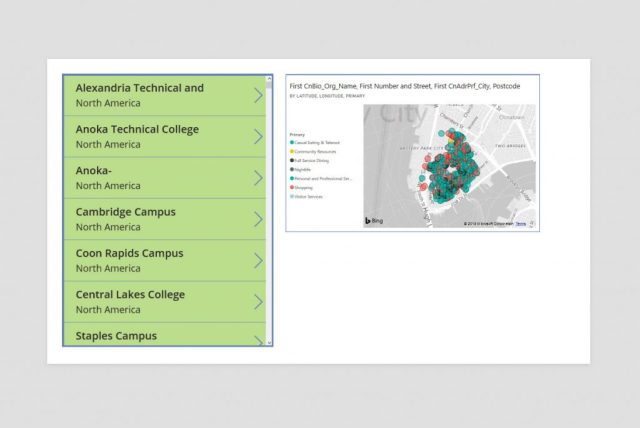
Once the tile is on the canvas, another pane opens up that asks you to choose a workspace, dashboard and a tile from that dashboard to be displayed in the PowerApps Power BI tile.

Set those values, and hey, your Power BI tile is now embedded in your PowerApps app! You can add as many Power BI tiles as you’d like.

Bringing It All Together
PowerApps has its own visualizations capabilities but they are extremely limited in what they can do and display. The ability to bring in Power BI tiles so easily gives access to very rich analytics. This also lets PowerApps developers use visualizations created by someone else – possibly someone on the data side who understands analytics needs of users better than the developers.